
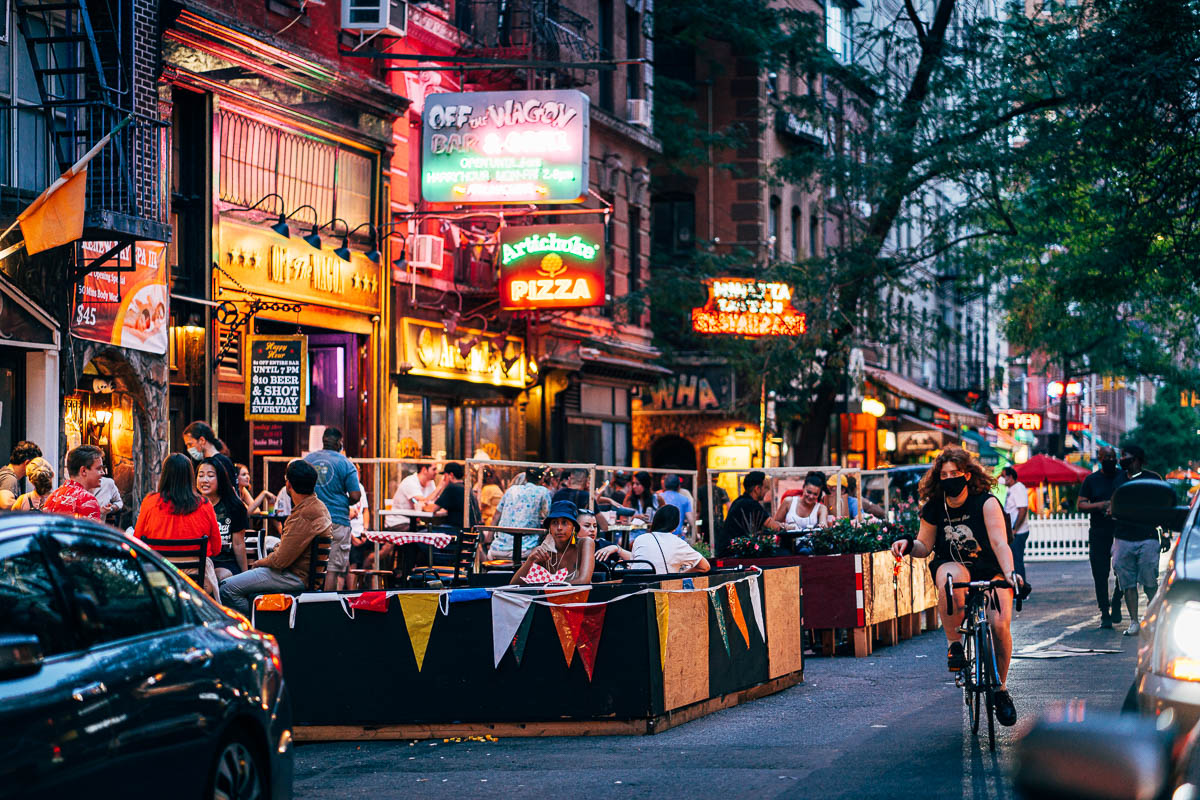
An open dining setup by Miss Lily’s in the East Village. Photo used with permission from Eric Leong’s wonderful “phase one” photo album, documenting early outdoor dining setups in lower Manhattan.
The restaurant industry in New York has endured a brutal stroke of bad fortune since the COVID-19 lockdowns began in March 2020. Any restaurants which survived through 2020/21 have proven an incredible ability to navigate their business through the peaks and valleys of COVID case numbers and their accompanying restrictions on indoor occupancy.
Thankfully New York has provided restaurants with a major lifeline: the Open Restaurants program. Enacted in June 2020, this program has allowed for restaurants to occupy part of the roads and sidewalks outside of their establishment and construct enclosures for outdoor dining. Since its inception, the program has been an enormous success; it has provided restaurants the ability to continue their business regardless of indoor dining restrictions, given New Yorkers a safe space to socialize through skyrocketing case numbers, and reshaped our streets to be more dynamic and alive.
Given that I am a huge fan of the program, I wanted to take some time to learn more about its rollout throughout the city. Thanks to NYC’s Open Data Portal, we can look at actual numbers to learn how the Open Restaurants program has developed over time, where it has seen adoption vs not, and most interestingly: determine which neighborhoods have the most outdoor dining options available. Let’s start by diving into the Department of Transportation’s Open Restaurants Applications dataset1.
How has the program developed over time?
The first question I set out to answer was how many restaurants adopted the program over time.
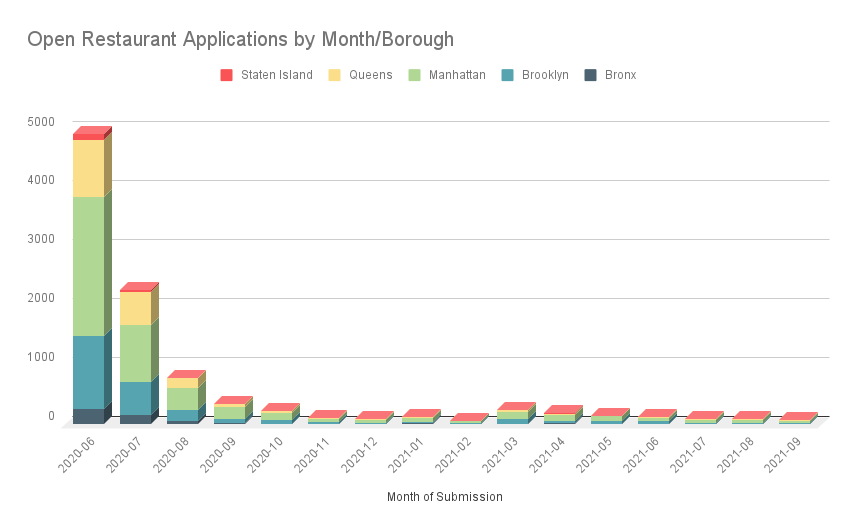
The enormous flood of applications in the first two to three months of the program’s opening speaks volumes about how urgently this form of relief was for restaurants. This response should be expected: the reallocation of space was essentially a reallocation of a substaial subsidy from automobile owners to restaurants. Space is both scarce and expensive in New York, and restaurants took advantage of a good deal when it was offered to them.
We also can catch a glimpse into the effects of temperature on applications. As summer turned into fall and eventually winter, we see the number of applications dwindle as weather got colder. Anyone who spent winter in New York can make an educated guess as to why: while outdoor dining continued through the frost, there was only so much the space heaters could do to make the experience as pleasant as it was in the warmer months. We can see applications start to bounce back starting in March ‘21 when things started to warm up again, but nowhere near as much as June ‘20. This discrepancy can likely be explained by most, if not all, of restaurants who were eligible for the program applying in 2020.
Was the program adopted equally amongst the boroughs?

We can also break down the full set of applications by borough to get a sense of where open restaurants have popped up the most. As we can see by the pie chart, Manhattan holds the lion’s share of outdoor restaurant setups compared to the other boroughs with 48% of all approved applications. While it makes for a nice visualization, this comparison doesn’t give us the full story. If we compare the data to the Department of Health’s complete list of restaurants in the city, we see that Manhattan also has the most restaurants of the boroughs, skewing our percentages in its favor:
Counts of Restaurants vs Approved Applications, by Borough
| Total Restaurants | Approved Applications | % Open Restaurants | |
|---|---|---|---|
| Bronx | 2,664 | 539 | 20.23% |
| Brooklyn | 7,531 | 2,442 | 32.43% |
| Manhattan | 11,508 | 4,711 | 40.94% |
| Queens | 6,752 | 1,990 | 29.47% |
| Staten Island | 1,073 | 163 | 15.9% |
This table provides us with a fairer way to visualize and compare the boroughs’ uptake of the Open Restaurants program: by percentage of their restaurants with an approved Open Restaurants application.
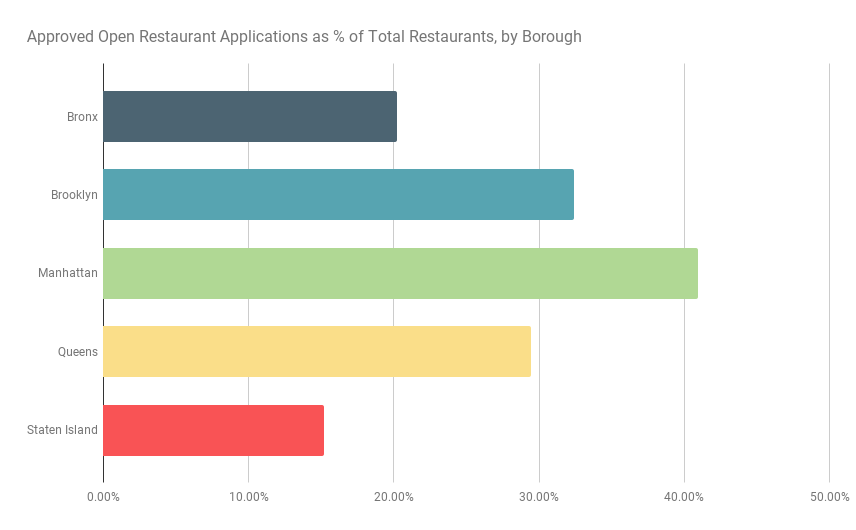
Broken down this way, we can see that Manhattan is still in the lead with 41% of its restaurants having an approved outdoor dining setup, however Brooklyn and Queens are closer behind than before with 32% and 29% respectively. It’s tough to speculate on the reason for this disparity without more data, however it would be interesting to see studies on how walkability of neighborhoods and median income correlate to the availability of outdoor dining.
What are the best neighborhoods for outdoor dining?
The final (and most fun) question I wanted to answer was which neighborhoods have the most outdoor dining options? A caveat with this analysis is that the dataset labels neighborhoods using Neighborhood Tabulation Areas, which differ from the colloquial neighborhood boundaries used by most New Yorkers. For any that look unfamiliar, you can find a map of NTAs here.
To simplify things, I’ve broken the list down by borough and selected the top 5 neighborhoods in each:
Top Neighborhoods for Outdoor Dining, by Borough
| Neighborhood | # of Restaurants | |
|---|---|---|
| Manhattan | West Village | 474 |
| Midtown-Midtown South | 448 | |
| SoHo-TriBeCa-Civic Center-Little Italy | 383 | |
| East Village | 373 | |
| Hudson Yards-Chelsea-Flatiron-Union Square | 347 | |
| Brooklyn | Northside-Southside (Williamsburg) | 260 |
| Park Slope-Gowanus | 205 | |
| Bushwick North | 144 | |
| Bay Ridge | 126 | |
| DUMBO-Vinegar Hill-Downtown BK-Boerum Hill | 120 | |
| Queens | Astoria | 253 |
| Hunters Pt.-Sunnyside-West Maspeth | 183 | |
| Jackson Heights | 155 | |
| Ridgewood | 94 | |
| Flushing | 86 | |
| Bronx | Belmont | 54 |
| Mott Haven-Port Morris | 30 | |
| Spuyten Duyvil-Kingsbridge | 27 | |
| West Concourse | 23 | |
| Pelham Bay-Country Club-City Island | 23 | |
| Staten Island | Stapleton-Rosebank | 24 |
| New Dorp-Midland Beach | 18 | |
| Charleston-Richmond Valley-Tottenville | 18 | |
| Great Kills | 13 | |
| New Brighton-Silver Lake | 12 |
Much of this list is relatively unsurprising; that is, most people could guess that the West Village has a thriving outdoor dining scene. That being said, hopefully this list can provide some new neighborhoods to visit while exploring the city. Bay Ridge is now on my map as a new neighborhood to check out next time I’m in South Brooklyn. The list also gives Belmont some much deserved visibility, as many don’t know that it contains the real Little Italy of New York.
This blog post scratches the surface of what is possible with the data available on NYC’s Open Data Portal. Other considerations for the curious reader would be to link neighborhood COVID outcomes with the number of open restaurants available (perhaps the availability of outdoor options allows residents to socialize more safely?) or to look into the equity of the program’s rollout by linking open restaurant presence with median incomes of areas. Open Restaurants is still a young program, and there are many questions that should be answered to determine how it moves forward in the future. This research is particularly pertinent now that the city has made the Open Restaurants program a permanent feature of our streetscapes, ensuring that New Yorkers will be able to enjoy dining al fresco for generations to come.